Published on
Multifamily rent growth, which has followed a gradual slowdown over the past year, continued its deceleration in March, according to the latest report from Apartments.com.
Year-over-year rent growth slowed to 0.4 percent in March, a slight deceleration from February’s adjusted rate of 0.5 percent.
This continued trend, with rent growth falling from 1.5 percent in March of last year, suggests that this year’s peak leasing season may be slower than usual to gain momentum.
Rents rise slightly month over month, but momentum falls below average
While year-over-year rent growth slipped to 0.4 percent in March, the monthly change showed a slight uptick. Asking rents in March rose 0.2 percent from February, bringing the average national asking rent to $1,723.
Typically, rent growth accelerates in early spring as leasing activity picks up through spring and summer. This year, however, seasonal rent growth is building more gradually. This slower pace, due to a continued oversupply relative to demand, offers another sign of a delayed multifamily recovery.
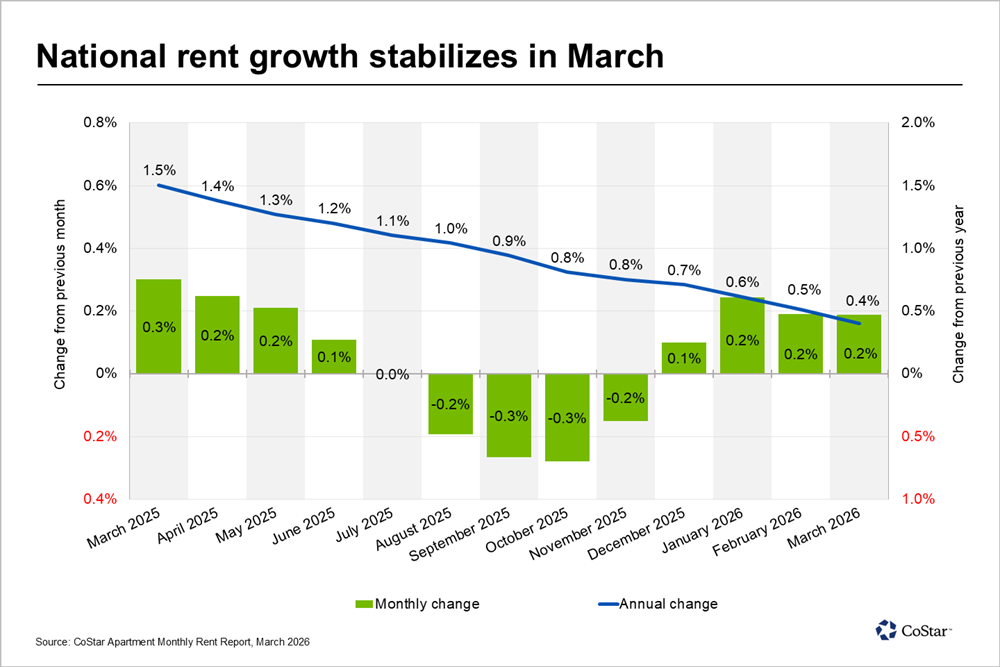
Over the last year, rent growth has been on a downward trend, decelerating every month. Rent growth last year fell from 1.5 percent in March 2025 to close the year at 0.7 percent. Over the first quarter of 2026, rent growth has slowed further, decelerating from 0.6 percent in January to 0.4 percent in March.
Regional trends hold, with Midwest still ahead
At the regional level, performance was mixed. The Midwest retained its position as the nation’s rent growth leader, posting 1.9 percent annual rent growth. It was followed by the Northeast, where rents grew annually by 1 percent.
To reflect the diverging market dynamics within the West, this region has been split into two distinct regions. In the Pacific region, rents grew by 0.7 percent, while the Mountain region saw rents decline by 2.2 percent.
Much like the Mountain region, the South also posted negative rent growth, although its decline was less steep. Rents fell in the South by 1.3 percent year over year. Both regions have struggled with a flood of new construction and insufficient demand.
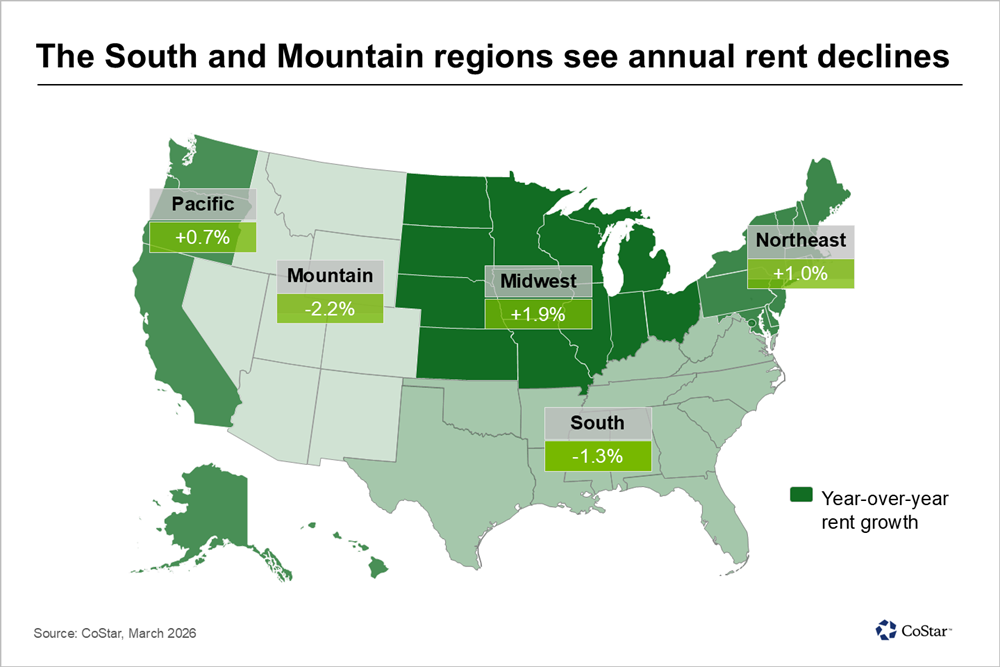
All five regions saw March asking rents rise slightly over February, with increasing ranging from 0.1 percent to 0.3 percent.
Negative rent growth expands to half of major metros
Across the 50 largest metros, fewer than half posted significant increases in annual rent growth. Twenty-five saw rents remained in — or entered — negative territory, while two markets stayed flat with no change, and only 23 metros saw asking rents rise.
San Francisco once again led the nation. This high-performing multifamily market, which has benefited from limited development paired with an AI-driven demand boom, posted rent growth of 6.3 percent.
Norfolk, Virginia, whose strong local economy has driven high demand, held onto the #2 spot and posted 4.2 percent rent growth. San Jose, which has enjoyed similar conditions to neighboring San Francisco, remained in third with 3.6 percent.
With 2.7 percent rent growth, Chicago also ranked among the top-performing markets, continuing the strong performance the Midwest powerhouse has shown in recent years.
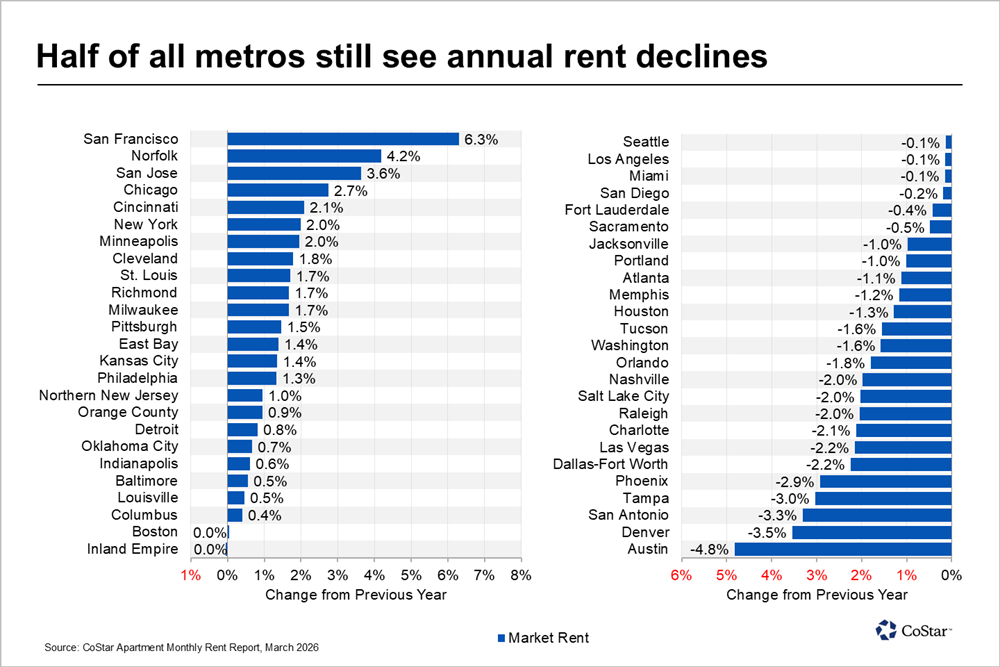
At the other end of the scale, Austin remained firmly at the bottom of the chart. With rents declining 4.8 percent year over year, Austin posted the weakest performance of all major markets. It was joined at the bottom of the chart by Denver and San Antonio, which posted year-over-year rent declines of 3.3 percent and 3.5 percent, respectively.
Supply overhang continues to weigh on performance
Even as the multifamily construction pipeline has begun to ease, the record number of units delivered in 2024 continues to curtail rent growth.
Renter demand has failed to meet elevated supply. A challenging labor market has weakened consumer confidence and slowed household formation. Also contributing is the slowdown in population growth, driven by an aging population and slowdown in immigration.
What’s happening in the multifamily market? Get the full picture
Zoom out to see what’s been happening in the multifamily over the past year and what’s projected for the rest of the year ahead. In a recent webinar, CoStar analyst Grant Montgomery breaks down the data. In less than 10 minutes, you’ll get an overview of supply trends, the demand outlook, and more. Watch now: